

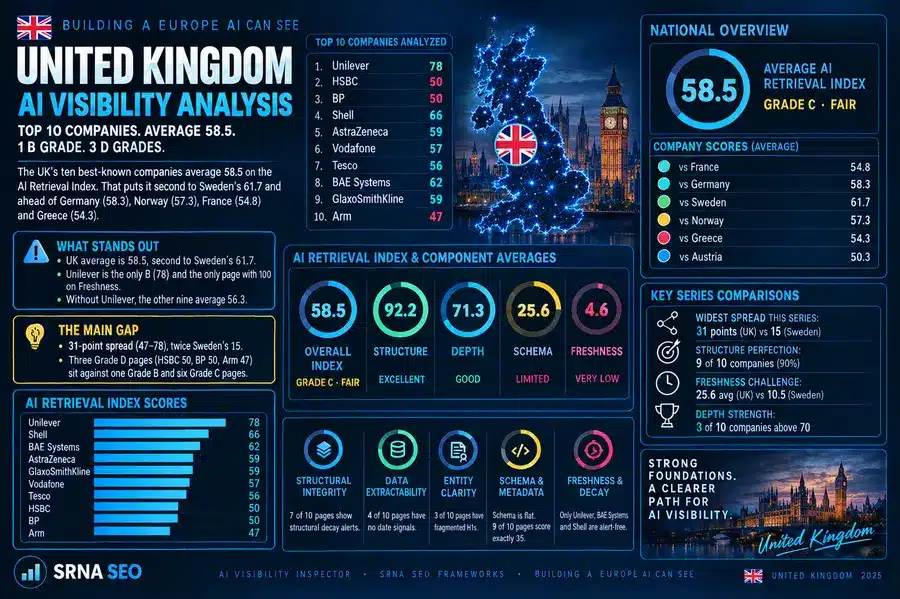
Ten of the United Kingdom’s best-known companies average 58.5 on the AI Retrieval Index. Set against the figures in the Sweden analysis, that is second to Sweden’s 61.7 and ahead of Germany (58.3), Norway (57.3), France (54.8) and Greece (54.3). The average hides the shape of the result. Sweden’s ten companies sat in a 15-point band and every one was a Grade C. The UK’s ten run 31 points, from Unilever’s 78 (Grade B) to Arm’s 47 (Grade D), and three of them, HSBC, BP and Arm, are Grade D.
This research is part of the Building a Europe AI Can See series, which also includes top-company analyses of Austria, Belgium, Croatia, Czechia, Cyprus, Denmark, Estonia, Finland, France, Germany, Greece, Hungary, Ireland, Norway, Sweden and United Kingdom.
Read also the United Kingdom National AI Profile, the audit of the UK government’s own pages, which this article is the corporate pair of.
Key Takeaways
- The UK average is 58.5, second to Sweden’s 61.7. Unilever is the only B (78) and the only page that scores 100 on Freshness. Without it the other nine average 56.3.
- The spread is 31 points, twice Sweden’s 15. Three Grade D pages (HSBC 50, BP 50, Arm 47) sit against one Grade B and six Grade C pages.
- The three D grades are exactly the three companies flagged for multiple H1 tags. HSBC has 2, Arm 3 and BP 4. Sweden recorded zero H1 problems.
- Seven of ten pages show a structural decay alert, against nine of ten in Sweden. Four carry no date signals and three carry fragmented H1s. Only Unilever, BAE Systems and Shell are alert-free.
- Freshness averages 25.6, more than double Sweden’s 10.5, but it is carried by three pages. The other seven average 4.6.
- Schema is flat. Nine of the ten pages score exactly 35. Unilever, at 50, is the only exception.
Methodology
Each page was audited with the AI Visibility Inspector, which reads a page the way an AI retrieval system does and returns an AI Retrieval Index from 0 to 100 and a letter grade. The index is built from four dimensions, using the Ivica Srncevic Framework: Structure (heading hierarchy and page architecture), Depth (how much extractable content sits behind the page), Schema (structured data and metadata) and Freshness (whether the page carries date signals an AI system can use to judge how current it is).
The audited URLs are the ten companies’ front doors:
- https://www.astrazeneca.com/
- https://www.arm.com/
- https://www.baesystems.com/en
- https://www.bp.com/
- https://www.gsk.com/en-gb/
- https://www.hsbc.com/
- https://www.riotinto.com/
- https://www.rolls-royce.com/
- https://www.shell.com/
- https://www.unilever.com/
Two points about the set. Several of these are the global group sites rather than UK-specific pages, which is how the Inspector reads them: Shell and Unilever are parsed as “Shell Global” and “Unilever Global”. BAE Systems and GSK are audited at their localised entry points, /en and /en-gb/. And the two series are not independent: AstraZeneca also appears in the Sweden analysis, and its audit here returns the same 59 and the same Freshness of 4. It is counted in both countries’ averages.
The Scores
| Company | AI Retrieval Index | Grade | Structure | Depth | Schema | Freshness | Alert |
|---|---|---|---|---|---|---|---|
| Unilever | 78 | B – Good | 95 | 80 | 50 | 100 | None |
| BAE Systems | 65 | C – Fair | 95 | 80 | 35 | 63 | None |
| Shell | 64 | C – Fair | 100 | 70 | 35 | 61 | None |
| AstraZeneca | 59 | C – Fair | 100 | 80 | 35 | 4 | No date signals |
| Rio Tinto | 58 | C – Fair | 100 | 85 | 35 | 4 | No date signals |
| Rolls-Royce | 57 | C – Fair | 95 | 85 | 35 | 8 | No date signals |
| GSK | 57 | C – Fair | 100 | 75 | 35 | 0 | No date signals |
| HSBC | 50 | D – Poor | 70 | 75 | 35 | 0 | 2 H1 tags |
| BP | 50 | D – Poor | 65 | 80 | 35 | 16 | 4 H1 tags |
| Arm | 47 | D – Poor | 65 | 75 | 35 | 0 | 3 H1 tags |
| Average | 58.5 | 88.5 | 78.5 | 36.5 | 25.6 |
The median is 57.5. Six companies are Grade C, one is Grade B and three are Grade D.
Five Findings the UK Corporate Sector Needs to See
Finding 1: A 31-Point Spread, Twice Sweden’s
Sweden’s ten companies were separated by 15 points, from Skanska’s 56 to Volvo Group’s 71. The UK’s are separated by 31, from Arm’s 47 to Unilever’s 78. The middle is not unusual: six of the ten sit between 57 and 65, and the median of 57.5 is close to Sweden’s 61.7 average. What stretches the range is the two ends. One company is well above anything in the Swedish set, and three are below it. A UK average of 58.5 therefore describes only the six in the middle.
Finding 2: Unilever Is the Only B, and Carries the Average
Unilever scores 78 with a Structure of 95, Depth of 80, Schema of 50 and Freshness of 100. It is the only company in the UK set with a Schema score above 35 and the only one with a perfect Freshness score. At 78 it is also seven points above Volvo Group’s 71, the best score in the Swedish analysis. Take Unilever out and the other nine average 56.3, 2.2 below the full set. The nearest company is BAE Systems at 65, 13 points behind.
Finding 3: The Three D Grades Are the Three H1 Failures
HSBC, Arm and BP are the only companies flagged for fragmented intent, with 2, 3 and 4 H1 tags respectively. They are also the only Grade D pages, with scores of 50, 47 and 50, and they have the three lowest Structure scores in the set: 70, 65 and 65. The other seven companies average 97.9 on Structure. The three H1 companies average 66.7.
Sweden recorded no H1 problems at all, and its ten Structure scores never dropped below 95. In the UK, the H1 flag is the one factor that separates the bottom of the table from the rest. The contrast inside the energy sector shows it: Shell has a Structure score of 100 and scores 64, BP has a 65 and scores 50, a 14-point gap on two companies that share a sector.
Finding 4: Freshness Is Better Than Sweden’s, but Held by Three Pages
The UK Freshness average of 25.6 is well above Sweden’s 10.5. The reason is that three pages clear the freshness hurdle: Unilever at 100, BAE Systems at 63 and Shell at 61. Their average is 74.7. The other seven average 4.6, which is what the Sweden analysis found without Volvo Group (4.4).
Four of the seven carry the same warning Sweden’s companies did: no date signals found, content age unverifiable. AstraZeneca, Rio Tinto and Rolls-Royce score 4, 4 and 8, and GSK scores 0. The alert-free pages average 69.0 on the index and the flagged seven average 54.0, a 15-point difference. In Sweden the equivalent gap between Volvo Group and the rest was about 10.
HSBC and Arm also score 0 on Freshness, and BP scores 16, but the audit surfaces only their H1 alert, so these pages may lack date signals as well. The audit view does not show it.
Finding 5: Schema Sits on a Floor of 35
Nine of the ten companies score exactly 35 on Schema, whether their Structure score is 100 or 65. Whatever the other dimensions do, this one does not move. Only Unilever, at 50, is different. Depth is similarly narrow: every company is between 70 (Shell) and 85 (Rio Tinto, Rolls-Royce), an average of 78.5.
The practical reading is that the large differences in the UK set come from Structure and Freshness, the two dimensions where a company’s own publishing decisions show up page by page. Schema and Depth are, for the moment, close to a shared baseline.
The UK Paradox
British companies are not uniformly behind. Three of them clear the freshness test, and the strongest page in this set is a UK company’s. But the front-door pages of HSBC, BP and Arm describe themselves to an AI system with two, four and three competing H1s, and four more say nothing about when they were last updated. That is the paradox: the same ten pages hold a Grade B that beats Sweden’s best score and three Grade D pages. Both ends are decided by choices that sit entirely inside a company’s own content team.
For the public sector side of the same country, read the United Kingdom National AI Profile. It finds a similar split: the government pages that carry structured data score well above those that do not.
Want to know where your own company stands?
If you want a page-level reading of how AI systems see your organization, Get in Touch.
Calculate your potential exposure below
Enter your own data where possible. The AI Visibility Cost of Inaction Calculator estimates what poor AI visibility could cost your organization.
Inputs
Enter your own data where possible. Hover over labels or open “Methodology” for details on how each field is used.
From GA4, GSC, or your SEO platform. Use a 30–90 day average.
Session → lead / signup / purchase. Use decimal (e.g. 1.2 for 1.2%).
For B2B, use average deal value or LTV. Currency is symbolic here.
Used to show profit‑based cost of inaction. Leave at 100 to ignore.
Share of organic traffic from queries/pages likely to be influenced by AI answers and retrieval systems.
Based on observed traffic loss patterns in AI search and structural decay cases.
Expected organic growth if you do nothing special about AI visibility.
Plausible uplift over the chosen horizon based on case studies.
How these numbers are calculated (methodology)
Let:
- O₀ = monthly organic sessions
- CVRₒ = organic conversion rate (as a decimal)
- ARPC = average revenue per conversion
- GM = gross margin (as a decimal)
- E = AI exposure share (as a decimal)
- D = displacement rate (as a decimal)
- T = time horizon in months
Baseline monthly revenue:
- Revenue: \(R_0 = O_0 imes CVR_o imes ARPC\)
- Profit: \(R_{0,profit} = R_0 imes GM\)
Monthly revenue at risk (for a given D):
- \(R_{risk} = R_0 imes E imes D\)
- Profit version: \(R_{risk,profit} = R_{risk} imes GM\)
The tool computes R_risk for three scenarios:
- Conservative: D = 0.15
- Base: D = 0.30 (or your selected scenario)
- Aggressive: D = 0.50
Cost of Inaction over T months is approximated as:
- \(CoI(T) = R_{risk} imes T\)
- Shown as a range from conservative to aggressive.
The growth inputs (g₀, g₁) are currently used for narrative context and can be incorporated into a more advanced version that models opportunity cost explicitly.
This article was researched with help of AI. Image is generated by AI based on audit data.
