

In This Article
Key Takeaways
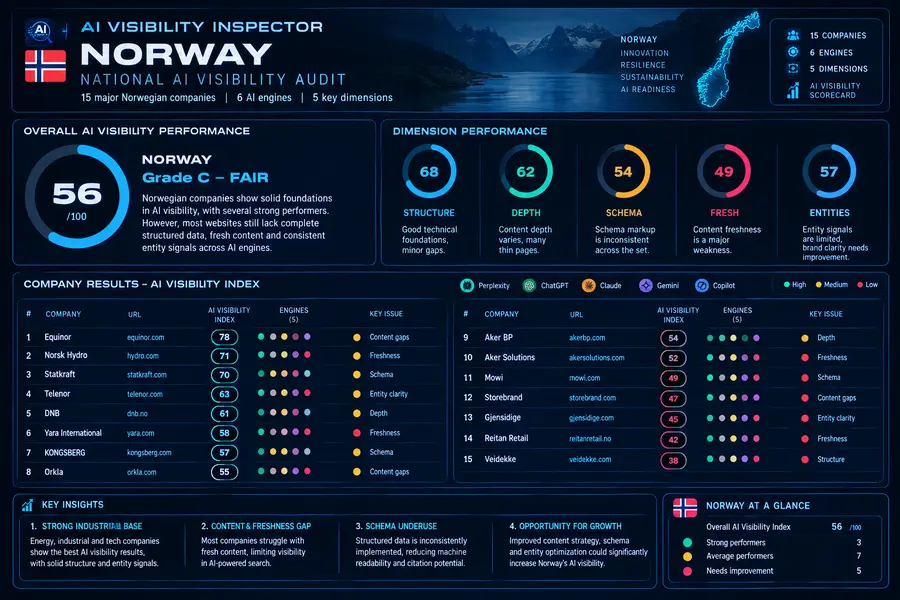
- Norway’s national average, 57.3, is the second-highest this series has recorded, behind only Germany’s 58.3, and ahead of France’s 54.8 and Greece’s 54.3.
- 8 of 10 companies triggered Structural Decay – 80%, tying the record France and Germany shared. But Norway breaks Greece’s streak in the other direction: Kongsberg and Equinor both cleared the audit clean, the first 20% clean rate this series has recorded since Germany.
- No Norwegian company reached Grade B. Kongsberg and Equinor tie for the country’s ceiling at 71 – seven points above Greece’s best (HelleniQ Energy, 64), but still short of Germany’s Allianz (74) and France’s Crédit Agricole (77), this series’ only two Grade B results to date.
- For the first time in this series, one failure mode dominates instead of splitting evenly: 5 of Norway’s 8 decayed companies – Orkla, Telenor, Aker Solutions, Aker BP, and Hydro – were flagged for the same problem, multiple competing H1 tags. That’s 62.5% of Norway’s decay warnings sharing one root cause, against Greece’s near-even three-way split.
- Freshness stops being a binary switch. Greece’s ten companies split into two clusters with nothing in between – near-zero or 65-plus. Norway’s ten Freshness scores run continuously from 0 to 85, with no gap wider than 29 points anywhere in the distribution.
- Six of Norway’s ten flagship companies carry significant Norwegian state ownership – Statkraft, Equinor, Telenor, Kongsberg, Yara, and DNB – and their scores span 47 to 71, a 24-point range inside a single ownership structure, before even counting the 15-point gap between the two Aker Group companies audited here.
Kongsberg. Orkla. Statkraft. Telenor. Yara. Aker Solutions. Aker BP. DNB. Equinor. Norsk Hydro. Ten companies that, between them, cover most of what actually moves Norway’s economy: its dominant aerospace, defense, and maritime technology group; its largest branded consumer goods conglomerate; its wholly state-owned hydropower utility; its national telecom operator; one of the world’s largest mineral fertilizer producers; two companies carrying the Aker name into energy engineering and offshore exploration; its largest bank; its national oil and gas major; and one of the world’s largest aluminium producers.
Published so far: Flagship Companies from Austria, Belgium, Croatia, Czechia, Cyprus, Denmark, Estonia, Finland, France, Germany, Greece, and now Norway, in the Building a Europe AI Can See series, the research hub tracking this project as it expands across the continent. The same AI Visibility Inspector and Ivica Srncevic Frameworks used across every prior report was applied here, unchanged.
Greece pushed Structural Decay to 100%, the first country in this series where not a single flagship homepage cleared the audit. Norway doesn’t repeat that. Eight of ten companies still trigger a warning – matching the 80% rate France and Germany posted before Greece broke it – but two companies, Kongsberg and Equinor, pass clean. That’s the first data point worth sitting with: after Greece’s perfect failure, the floor is real, and it can be beaten. The second data point is stranger. Where Greece spread its decay causes almost evenly across three failure types, Norway’s collapse mostly into one. Five of its eight decayed companies, five completely unrelated businesses spanning consumer goods, telecom, energy services, and metals, share the exact same structural defect.
Methodology
Each company’s primary corporate website was evaluated using the AI Visibility Inspector across four structural dimensions:
- Structure, how content is architecturally organized for machine parsing, including H1 clarity and navigational coherence
- Depth, the substantive quality and retrievability of content as AI systems process and extract it
- Schema, the presence of structured data markup that enables confident entity identification and citation
- Freshness, whether content age signals are present and verifiable to AI retrieval systems
The overall AI Retrieval Index score runs from 0 to 100. Scores below 50 indicate significant structural invisibility. Scores between 50 and 74 represent fair to moderate visibility with material gaps. Scores at 75 and above indicate good to strong AI readiness.
A Structural Decay warning is triggered when critical signals are absent or conflicting: a missing H1 tag preventing AI parsers from anchoring a primary topic, multiple competing H1 tags fragmenting intent, or absent or severely stale date signals leaving content age unverifiable.
The Scores
| Company | Sector | AI Retrieval Score | Grade | Structure | Depth | Schema | Freshness |
|---|---|---|---|---|---|---|---|
| Kongsberg | Aerospace, Defense & Maritime Technology | 71 | C – Fair | 95 | 75 | 50 | 65 |
| Equinor | Energy / Oil & Gas | 71 | C – Fair | 100 | 75 | 50 | 57 |
| Yara | Chemicals / Agriculture (Fertilizer) | 67 | C – Fair | 100 | 85 | 50 | 20 |
| Aker BP | Energy / Oil & Gas Exploration & Production | 63 | C – Fair | 70 | 75 | 35 | 85 |
| Hydro | Metals (Aluminium) | 62 | C – Fair | 70 | 75 | 50 | 49 |
| DNB | Banking | 55 | C – Fair | 100 | 75 | 35 | 0 |
| Telenor | Telecommunications | 49 | D – Poor | 70 | 80 | 35 | 4 |
| Aker Solutions | Energy / Oilfield Services & Engineering | 48 | D – Poor | 65 | 75 | 35 | 8 |
| Statkraft | Energy / Renewable Power (Hydropower) | 47 | D – Poor | 55 | 85 | 35 | 8 |
| Orkla | Consumer Goods | 40 | D – Poor | 70 | 48 | 20 | 8 |
National average: 57.3 – Grade C, AI Retrieval Index
Zero companies in Grade A. Zero in Grade B. Six in Grade C. Four in Grade D. Norway’s 57.3 average is the second-highest this series has confirmed, three points behind Germany’s 58.3 and comfortably ahead of France (54.8) and Greece (54.3). The score range runs from 40 to 71 – a 31-point spread, wider than Greece’s tight 23 points and Germany’s 28, but narrower than France’s 39-point field.
Five Findings Norway’s Corporate Sector Needs to See
Finding 1: Norway Ends Greece’s Zero-Clean Streak, Then Fails the Same Way Five Times Over
Eight of ten companies triggered a Structural Decay warning – 80%, matching the rate France and Germany each posted before Greece pushed it to 100%. But Norway is the first country since that record to produce any clean audits at all: Kongsberg and Equinor both pass without a warning, a 20% clean rate.
The causes, unlike Greece’s even three-way split, are lopsided:
- Multiple, fragmented H1 tags: Orkla (2 H1 tags), Telenor (2 H1 tags), Aker Solutions (14 H1 tags), Aker BP (2 H1 tags), and Hydro (2 H1 tags) – five companies, 62.5% of every decay warning issued in this report.
- Missing H1 tag entirely: Statkraft – one company.
- Missing date signals: DNB – one company.
- Severe freshness decay: Yara, flagged for content 1,538 days old with no update signal – a failure type this series has not previously recorded as its own category, distinct from simply having no date field at all.
Aker Solutions is the outlier within the outlier. Its 14 H1 tags dwarf every other fragmented-H1 case in this report – the other four companies in that group each carry exactly two.
Finding 2: The Failure Type Still Predicts the Structure Score
The pattern this series identified in Greece holds again, more sharply. Norway’s two metadata-only failures, DNB (missing dates) and Yara (severe freshness decay), average a Structure score of 100 – perfect. The five fragmented-H1 companies average a Structure score of 69.0. Statkraft, the sole missing-H1 case, sits at 55, the lowest Structure score in the entire Norwegian sample.
The overall AI Retrieval Index follows the same shape: the metadata-only group averages 61.0, the fragmented-H1 group averages 52.4, and Statkraft alone sits at 47. A missing or stale date is a signal gap layered on top of a well-built page. A missing or multiplied H1 is an architecture problem, and it costs 30 to 45 Structure points regardless of how strong the rest of the site is – the same relationship this series first measured in Greece, now confirmed in a country with a completely different dominant failure type.
Finding 3: No Grade B, But the Highest Ceiling a “Zero-B” Country Has Produced
Kongsberg and Equinor tie at 71, the highest score in Norway’s sample and seven points clear of Greece’s ceiling, HelleniQ Energy’s 64. It still isn’t enough. Both sit short of Germany’s Allianz (74) and well short of France’s Crédit Agricole (77), the only two Grade B results this series has produced. Every Norwegian company audited here lands in the “fair to moderate visibility with material gaps” band, and four fall through to “significant structural invisibility.”
There’s a smaller distinction worth noting between Norway’s two co-leaders. The AI Assessment for Equinor’s homepage resolves a descriptive tagline – the page is parsed as being about “Equinor: Providing reliable energy for a world in transition.” Kongsberg’s equivalent assessment resolves only the bare brand name, “KONGSBERG,” with no descriptive framing attached. Two companies, an identical score, and a visibly different amount of contextual signal available to whatever system is trying to cite them.
Finding 4: Freshness Finally Behaves Like a Spectrum
Greece’s Freshness scores split into two populations with nothing between them – eight companies near zero, two companies at 69 and 85, a 65-point gap with no entries inside it. Norway doesn’t reproduce that shape. Sorted low to high, its ten Freshness scores read: 0 (DNB), 4 (Telenor), 8 (Orkla), 8 (Statkraft), 8 (Aker Solutions), 20 (Yara), 49 (Hydro), 57 (Equinor), 65 (Kongsberg), 85 (Aker BP). The widest gap anywhere in that sequence is 29 points, less than half of Greece’s cleanest break.
The average, 30.4, is meaningfully higher than Greece’s 0.5-and-77-averaged-together shape would suggest, and it comes from an actual distribution rather than two clusters standing in for one. Whatever produces Freshness signals in Norway’s flagship sites, it isn’t a single missing field that’s either present or absent everywhere at once – dateModified markup, visible “last updated” text, and structured publication dates appear to be implemented inconsistently across individual pages rather than adopted or skipped at the company level.
Finding 5: A State Shareholder in Six of Ten Companies, and No Shared Playbook
Six of the ten companies audited in this report carry significant Norwegian state ownership: Statkraft (wholly state-owned via Statkraft SF), Equinor (majority state-owned), Telenor (majority state-owned), Kongsberg Gruppen (roughly half state-owned), Yara (over a third state-owned), and DNB (roughly a third state-owned, held through the Norwegian government). Their AI Retrieval Index scores: Statkraft 47, Equinor 71, Telenor 49, Kongsberg 71, Yara 67, DNB 55. That’s a 24-point spread inside a single, common ownership structure – the Norwegian state – echoing this series’ earlier finding on Greece’s three systemic banks, but across six companies rather than three, and across five different industries rather than one regulated sector.
A smaller version of the same story sits inside the sample on its own. Aker Solutions and Aker BP both carry the Aker name and trace back to the same Aker ASA industrial group. Aker Solutions scores 48, Grade D, flagged for 14 competing H1 tags. Aker BP scores 63, Grade C, flagged for just 2. Fifteen points and one grade band separate two companies built from the same corporate lineage, using the same brand, likely built by overlapping web teams.
Common ownership, in both cases, produced no common approach to how – or whether – an AI system can anchor, date, and cite the page in front of it.
The Norwegian Paradox
Norway’s flagship companies build for human visitors well, with one loud exception. Depth averages 74.8 across the sample, and nine of the ten companies land in a tight 70-to-85 band – but Orkla’s Depth score, 48, sits far outside it, more than 20 points below the next-lowest company. Remove Orkla and Norway’s Depth consistency looks almost identical to Greece’s; include it, and Norway has the one genuinely substandard content page this report identified on any dimension other than Freshness or Schema.
Schema tells the same story it tells everywhere else in this series. Norway’s average, 39.5, sits close to Germany’s 37.0 and Greece’s 35.5 – a weak point that shows up regardless of language, market size, ownership structure, or sector. Structured data remains the dimension every country in this project treats as optional, and Norway, despite its stronger overall average, is no exception.
What distinguishes Norway from every prior report isn’t a capability gap either – that conclusion has held for every country this series has audited. It’s that when the failures cluster, they cluster hard around one specific mistake: shipping a page with more than one H1 tag. Five completely unrelated Norwegian flagships made an identical structural decision, or inherited an identical CMS default, and it cost each of them roughly the same 30-plus Structure points and the same grade band.
The commercial stakes read the same as every prior report in this series. When someone asks an AI assistant which of Norway’s Aker companies is better positioned in offshore energy services, or how the Norwegian state’s six major shareholdings compare on digital transparency, or what Orkla actually makes beyond a homepage an AI system finds harder to read deeply than Statkraft’s, the answer depends on signals fewer than a third of these ten companies fully provide today.
A country whose sovereign wealth and flagship sector overlap this heavily – where the state itself is a shareholder in six of the companies being measured – still produced zero companies an AI system can confidently anchor, date, and cite all at once, using its own state-owned infrastructure as the clearest illustration of the gap.
Want to know where your own company stands?
If you’d like a free AI visibility check, similar to the ones behind this report, get in touch and I’ll run your site through the same framework and send you the results.
Research Date: September 2026 | Methodology: Ivica Srncevic Framework + AI Visibility Inspector. This research is independent, not sponsored by any organization or legal entity. All company names and logos are used for identification and analysis purposes only.
This article was researched and drafted with the assistance of AI tools and reviewed and edited by author prior to publication. Images are AI generated.
