

In This Article
This research is part of the Building a Europe AI Can See series, which also includes top-company analyses of Austria, Belgium, Croatia, Czechia, Cyprus, Denmark, Estonia, Finland, France, Germany, Greece, Hungary, Ireland, Norway, Sweden and the United Kingdom, the installment published immediately before this one.
Read also the United Kingdom National AI Profile, the audit of the UK government’s own pages and the public-sector pair of that corporate analysis.
Key Takeaways
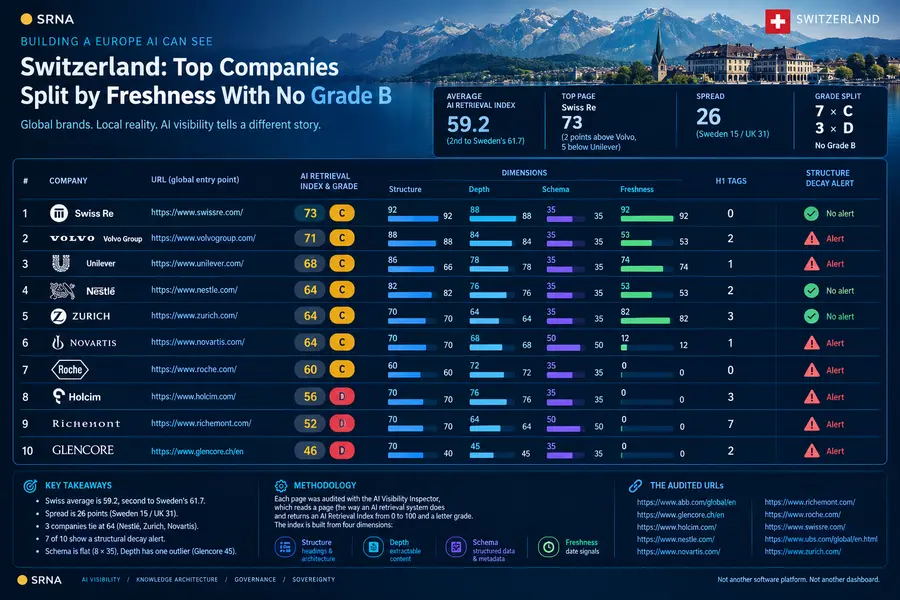
- The Swiss average is 59.2, second to Sweden’s 61.7. Swiss Re is the top page at 73, two points above Volvo Group’s 71 (the best score in Sweden) and five below Unilever’s 78 in the UK set. No company reaches Grade B: seven are Grade C and three are Grade D.
- The spread is 26 points, between Sweden’s 15 and the UK’s 31. Three companies tie at 64 (Nestlé, Zurich and Novartis) with three different profiles.
- Freshness splits the set in two. Swiss Re (92), Zurich (82), UBS (77) and Nestlé (53) average 76.0. The other six average 0.5, and five of them score exactly 0. Three of the four fresh pages belong to the three financial-services companies.
- The H1 flag again marks the weakest structure. Roche (no H1 tag), Richemont (7), Holcim (3) and Zurich (3) have the four lowest Structure scores (60, 70, 70, 70) and average 67.5, against 96.7 for the other six. Richemont’s 7 H1 tags are more than any UK company recorded (BP, 4).
- Seven of ten pages show a structural decay alert, the same as the UK and fewer than Sweden’s nine. Three carry no date signals, three carry fragmented H1s and one has no H1 at all. Only Nestlé, Swiss Re and UBS are alert-free.
- Schema is flat again, and Depth has one outlier. Eight of ten pages score exactly 35 on Schema, with Richemont and Novartis at 50. Glencore’s Depth of 45 is 30 points below the next-lowest page, while the other nine average 81.3.
Methodology
Each page was audited with the AI Visibility Inspector, which reads a page the way an AI retrieval system does and returns an AI Retrieval Index from 0 to 100 and a letter grade. The index is built from four dimensions, using the Ivica Srncevic Frameworks: Structure (heading hierarchy and page architecture), Depth (how much extractable content sits behind the page), Schema (structured data and metadata) and Freshness (whether the page carries date signals an AI system can use to judge how current it is).
The audited URLs are the ten companies’ front doors:
- https://www.abb.com/global/en
- https://www.glencore.ch/en
- https://www.holcim.com/
- https://www.nestle.com/
- https://www.novartis.com/
- https://www.richemont.com/
- https://www.roche.com/
- https://www.swissre.com/
- https://www.ubs.com/global/en.html
- https://www.zurich.com/
Two points about the set. First, most of these are global group sites rather than Swiss-specific pages, which is how the Inspector reads them: Nestlé is parsed as “Nestlé: Good food, Good life”, Swiss Re as “Swiss Re Group” and UBS as “UBS financial services around the globe”. ABB and UBS are audited at their global English entry points (/global/en and /global/en.html), and Glencore at its Swiss-domain English page, glencore.ch/en. Second, each score describes one page per company, the one a visitor or an AI system meets first. It is not a reading of the group’s whole web estate.
The Scores
| Company | AI Retrieval Index | Grade | Structure | Depth | Schema | Freshness | Alert |
|---|---|---|---|---|---|---|---|
| Swiss Re | 73 | C – Fair | 95 | 85 | 35 | 92 | None |
| UBS | 68 | C – Fair | 95 | 75 | 35 | 77 | None |
| Zurich | 64 | C – Fair | 70 | 80 | 35 | 82 | 3 H1 tags |
| Nestlé | 64 | C – Fair | 95 | 80 | 35 | 53 | None |
| Novartis | 64 | C – Fair | 100 | 85 | 50 | 0 | No date signals |
| ABB | 56 | C – Fair | 95 | 85 | 35 | 0 | No date signals |
| Richemont | 55 | C – Fair | 70 | 75 | 50 | 0 | 7 H1 tags |
| Holcim | 52 | D – Poor | 70 | 85 | 35 | 0 | 3 H1 tags |
| Glencore | 49 | D – Poor | 100 | 45 | 35 | 0 | No date signals |
| Roche | 47 | D – Poor | 60 | 82 | 35 | 3 | No H1 tag |
| Average | 59.2 | 85.0 | 77.7 | 38.0 | 30.7 |
The median is 60.0. Seven companies are Grade C, none is Grade B and three are Grade D. Ties at 64 are ordered by Freshness.
Five Findings the Swiss Corporate Sector Needs to See
Finding 1: A 26-Point Spread and No Grade B
Switzerland’s ten companies run 26 points, from Roche’s 47 to Swiss Re’s 73. That sits between Sweden’s 15 and the UK’s 31. The ranking is lumpy rather than even: three companies tie at 64, two pages sit above them at 68 and 73, and the bottom three run from 47 to 52. The average of 59.2 and the median of 60.0 describe a middle that is thinly populated.
No page reaches Grade B. Swiss Re’s 73 is two points above Volvo Group’s 71, the best score in the Swedish set, and five below Unilever’s 78, the only B in the UK set. Its nearest follower is UBS at 68. Take Swiss Re out and the other nine average 57.7, 1.5 below the full set.
Finding 2: Freshness Splits the Set, and Financial Services Sits on the Fresh Side
Four pages carry a Freshness score of 53 or more: Swiss Re (92), Zurich (82), UBS (77) and Nestlé (53). They average 76.0. The other six score 0, 0, 0, 0, 0 and 3, an average of 0.5. The Swiss Freshness average of 30.7 is above the UK’s 25.6 and almost three times Sweden’s 10.5, but, as in the UK, a few pages carry it. Three of the four fresh pages are the financial-services companies, which average 83.7 on Freshness. The other seven companies average 8.0, below Sweden’s figure for its whole set.
Two pairs show what the signal is worth. ABB and Swiss Re post identical Structure (95), Depth (85) and Schema (35). ABB’s Freshness is 0 and Swiss Re’s is 92, and the index gap is 17 points, 56 against 73. Zurich and Holcim are both flagged for 3 H1 tags, and both score 70 on Structure and 35 on Schema. Zurich’s Freshness of 82 against Holcim’s 0 turns the same structural flaw into a Grade C (64) instead of a Grade D (52), even though Holcim’s Depth is five points higher (85 against 80).
Novartis is the one undated page in the top half of the table. Its Structure of 100, Depth of 85 and Schema of 50 carry it to 64 with a Freshness of 0. For the three pages whose alert reads “no date signals” (Glencore, ABB and Novartis), the banner names the remedy: add dateModified JSON-LD.
Finding 3: The H1 Flag Marks the Weakest Structure
Roche (no H1 tag), Richemont (7 H1 tags), Holcim (3) and Zurich (3) are the four pages with an H1 alert. They have the four lowest Structure scores in the set, 60, 70, 70 and 70, and average 67.5. The other six average 96.7, and none scores below 95.
Two things differ from the UK. Roche’s alert is the opposite failure, no H1 at all, so AI parsers cannot anchor a primary topic. And Richemont’s 7 H1 tags are more than any UK page recorded, where BP had the most with 4. In the UK the H1 flag marked all three Grade D pages. Here it marks two of the three (Roche and Holcim), because Zurich’s Freshness keeps it in Grade C and Glencore’s D has a different cause (Finding 5).
The contrast inside one sector shows the cost. Novartis and Roche, the two healthcare groups in the set, are 17 points apart, 64 against 47, and the gap is Structure: 100 for Novartis, 60 for Roche. The same pattern appeared in the UK energy pair of Shell and BP.
Finding 4: Seven Alerts, and Schema Stuck at 35
Seven of ten pages show a structural decay alert, the same count as the UK and two fewer than Sweden’s nine. Three carry no date signals (Glencore, ABB and Novartis), three carry fragmented H1s (Richemont, Holcim and Zurich) and one has no H1 at all (Roche). Only Nestlé, Swiss Re and UBS are alert-free. They average 68.3 on the index and the flagged seven average 55.3, a 13.0-point gap against 15 in the UK. Richemont and Holcim also score 0 on Freshness, but the audit view surfaces one banner per page and shows only their H1 alert, so these pages may lack date signals as well.
Schema barely moves. Eight of the ten pages score exactly 35, and Richemont and Novartis score 50, which gives an average of 38.0 against 36.5 in the UK. The two pages at 50 sit at opposite ends of Structure, Novartis at 100 and Richemont at 70, so Schema is not following page architecture. It also leaves the top of the table with the same headroom as the bottom: Swiss Re, the highest page in the set, is at 35.
Finding 5: Glencore’s Depth Gap, and How AI Reads the Front Doors
Glencore is a Grade D for a reason no other page in the set shares. Its Structure of 100 is tied for the best, but its Depth of 45 is 30 points below the next-lowest page (UBS and Richemont, both at 75), and the other nine pages average 81.3. With a Freshness of 0 and a Schema of 35, the page lands at 49. The audit covers the Swiss-domain English page, glencore.ch/en. The score suggests that page carries little extractable content of its own, though the audit does not say why. Everywhere else Depth is narrow, with nine pages between 75 and 85.
The assessment text for the three alert-free pages shows what an AI system takes from the front door. The Inspector reads Nestlé as “Nestlé: Good food, Good life”, Swiss Re as “Swiss Re Group” and UBS as “UBS financial services around the globe”. All three are summarised as Grade C pages with key structural or schema signals missing, limiting citation eligibility. Only UBS’s reading says what the business does. Nestlé’s is a tagline and Swiss Re’s is a name.
The Swiss Paradox
Six of the ten Swiss front doors score 95 or more on Structure, and not one of them reaches Grade B. The six are Swiss Re, UBS, Nestlé, ABB, Novartis and Glencore. Three of them (Novartis, ABB and Glencore) carry no date signals and score 0 on Freshness. The other three (Swiss Re, UBS and Nestlé) are dated, but sit at 35 on Schema. The architecture is largely in place. What is missing sits on top of it: a date an AI system can read and structured data it can use. ABB and Swiss Re, identical on Structure, Depth and Schema, are 17 points apart for that reason alone.
The UK paradox was a Grade B beside three Grade D pages. The Swiss one is quieter. No page stands out at the top, and the three Grade D pages come from three different failures: Roche has no H1, Holcim has three H1 tags and no freshness signal, and Glencore has a thin page behind a perfect Structure score. Each is fixable inside a company’s own content team. For the corporate side of the series so far, compare the United Kingdom analysis, published immediately before this one, and the full list of countries on the Building a Europe AI Can See hub.
Want to know where your own company stands?
If you want a page-level reading of how AI systems see your organization, Get in Touch.
Calculate your potential exposure below
Enter your own data where possible. The AI Visibility Cost of Inaction Calculator estimates what poor AI visibility could cost your organization.
Inputs
Enter your own data where possible. Hover over labels or open “Methodology” for details on how each field is used.
From GA4, GSC, or your SEO platform. Use a 30–90 day average.
Session → lead / signup / purchase. Use decimal (e.g. 1.2 for 1.2%).
For B2B, use average deal value or LTV. Currency is symbolic here.
Used to show profit‑based cost of inaction. Leave at 100 to ignore.
Share of organic traffic from queries/pages likely to be influenced by AI answers and retrieval systems.
Based on observed traffic loss patterns in AI search and structural decay cases.
Expected organic growth if you do nothing special about AI visibility.
Plausible uplift over the chosen horizon based on case studies.
How these numbers are calculated (methodology)
Let:
- O₀ = monthly organic sessions
- CVRₒ = organic conversion rate (as a decimal)
- ARPC = average revenue per conversion
- GM = gross margin (as a decimal)
- E = AI exposure share (as a decimal)
- D = displacement rate (as a decimal)
- T = time horizon in months
Baseline monthly revenue:
- Revenue: \(R_0 = O_0 imes CVR_o imes ARPC\)
- Profit: \(R_{0,profit} = R_0 imes GM\)
Monthly revenue at risk (for a given D):
- \(R_{risk} = R_0 imes E imes D\)
- Profit version: \(R_{risk,profit} = R_{risk} imes GM\)
The tool computes R_risk for three scenarios:
- Conservative: D = 0.15
- Base: D = 0.30 (or your selected scenario)
- Aggressive: D = 0.50
Cost of Inaction over T months is approximated as:
- \(CoI(T) = R_{risk} imes T\)
- Shown as a range from conservative to aggressive.
The growth inputs (g₀, g₁) are currently used for narrative context and can be incorporated into a more advanced version that models opportunity cost explicitly.
This article was researched with help of AI. Image is generated by AI based on audit data.
